Unit 7 – School Survey
Warm-up and Vocabulary

Key Vocabulary
- Table: Information in rows and columns.
- Chart: A picture that shows information with bars, lines, or circles.
- Diagram: A simple drawing that explains something.
- Column: A line of words or numbers that goes up and down (vertical).
- Row: A line of words or numbers that goes from left to right (horizontal).
- Bar: A rectangle in a chart that shows a number.
- Legend: A key that explains the colors or symbols in a chart.
- Data: Information or facts.
- Survey: Asking questions to many people to get information.
- Title: The name of a table or chart.
Activity: Who is the New Class President?
Class President Election Results (Table)
| Candidate | Number of Votes |
| Asep | 11 |
| Amin | 7 |
| Safira | 5 |
| Susanti | 6 |
Class President Election Results
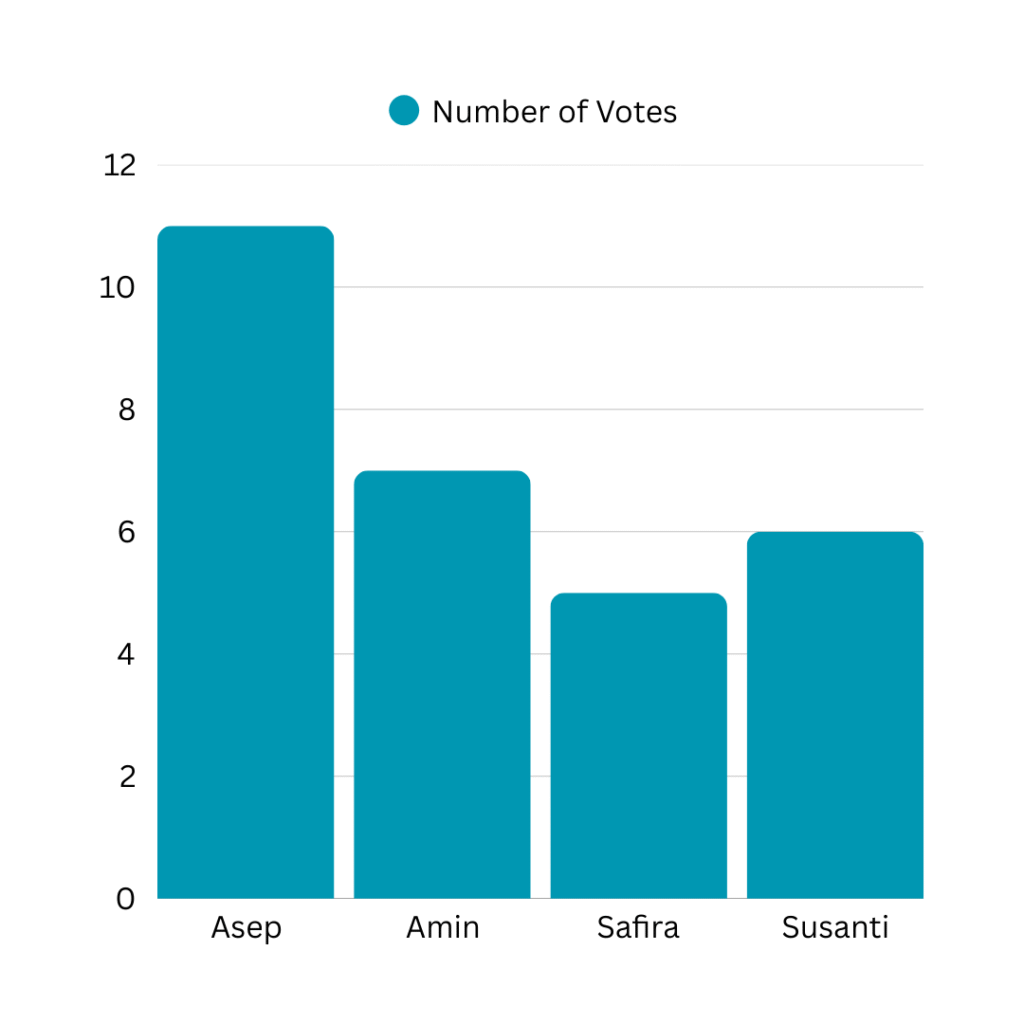
Who has the most votes? Who is the new class president?
Reading Tables and Charts
Tables and charts help us see information easily. They use pictures and short text.
What is a Table?
A table organizes data in rows and columns.
- Rows go from left to right.
- Columns go from top to bottom.
What is a Bar Chart?
A bar chart uses rectangles (bars) to show data. Longer bars mean bigger numbers. Shorter bars mean smaller numbers.
To understand a table or chart, you need to look at:
- The Title: What is the chart about?
- The Labels: What information is in the columns and rows?
Tips for Success
Here are some tips for reading tables and charts:
- Read the title first. The title tells you the main topic.
- Look at the labels. Read the words at the top of columns and on the sides of the chart.
- Use your finger to find information. Trace the row and column to find the data you need.
Skill Practice
The students of Grade 10-A did a survey. They asked, “What is your favorite subject?” Here are the results.
Grade 10-A: Favorite Subjects
| Subject | Number of Students |
| Math | 8 |
| English | 12 |
| Science | 6 |
| History | 4 |
| Art | 10 |
Use the table and chart above to answer the questions.
- Multiple-Choice
2. Crossword Puzzle
3. Word Search
4. Fill-in-the-Blank
Complete the sentences with words from the box.
| table | data | survey | column | title |
Interactive Game
My Class Survey
- Work with a partner.
- Choose one question to ask your classmates.
- Example Question: What is your favorite sport? (Options: Football, Badminton, Basketball, Swimming)
- Example Question: What is your favorite fruit? (Options: Banana, Apple, Mango, Orange)
- Ask 5 classmates your question. Write down their answers.
- With your partner, make a simple table or bar chart on a piece of paper to show your data.
- Show your chart to another group.
You’ve reached the end of the lesson. Click the button below to begin your Evaluation Quiz.